
Business Intelligence
Reporting Suite

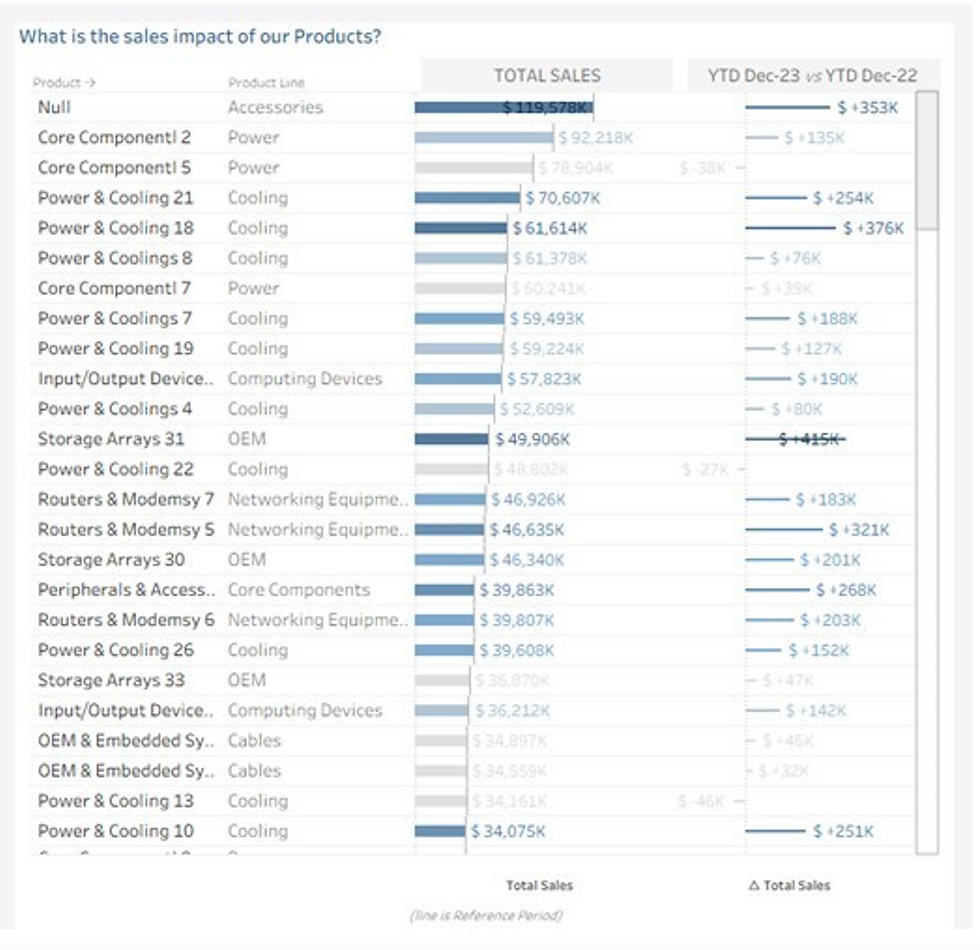
Customised BI Dashboards
Executive, finance, operations and inventory dashboards deliver real-time insights, helping leaders make faster, data-driven informed decisions.


Executive Summary


Welcome, User
Last Updated: Aug 11, 2025
Executive Level Reporting
Executives
Key Stakeholders
Sales Heads
Purpose
Guide strategic decisions, track overall performance, and illuminate high-level growth opportunities.
KPI
Description
Total
Revenue
Sum of all sales, broken down by accessory, service contracts, maintenance etc
Reveals business growth and revenue trends
YoY
Revenue Growth
Revenue comparison to
the previous year
Measures expansion velocity and seasonal impacts
New Customer Acquisition Rate
Number of new customers
per period
Gauges marketing and sales effectiveness
Customer
Retention Rate
Lifecycle repeat business and
maintenance contract renewals
Assesses satisfaction and loyalty strategies
Net Promoter
Score (NPS)
Customer willingness to recommend the company, it's products and team
Indicates brand advocacy and reputation
Market
Share
Share of local, or regional market (estimation)
Benchmarks against competitors
Project Completion Rate
Percentage of projects delivered on time and within scope
Reflects operational
efficiency
Marketing
Campaign ROI
Revenue generated per marketing campaign vs cost
Optimizes marketing spend allocation
Impact
Finance Department KPIs
Executives
Key Stakeholders
Finance Team
Purpose
Ensure profitability, scrutinize cost control, and enable budgeting precision.
KPI
Description
Gross Profit
Margin
(Revenue−COGS)/Revenue
Core profitability indicator
Net Profit
Margin
(Net Profit/Revenue)
Overall business profitability.
Average Sale
Value
Mean value per customer transaction
Tracks up-sell/cross-sell success.
Cost of Goods Sold (COGS)
Direct costs: labour, materials, subcontractors
Monitors profit leakage
Expense Ratio
Operating expenses as a percentage of total revenue
Reveals efficiency of expense management
Budget Variance
Difference between projected and actual spend
Identifies unplanned spend or savings
Cash Flow Forecast
Projected net cash inflows/outflows over time
Alerts for liquidity or funding needs
Revenue per Employee
Total revenue divided by total staff
Measures labour productivity and scales
Accounts Receivable Turnover
Frequency of collecting outstanding payments
Ensures liquidity and billing efficiency
Impact
Inventory KPIs
Executives
Operations Team
Finance Team
Purpose
To provide actionable insights into stock utilization, supply chain efficiency, and loss prevention.
KPI
Description
Inventory Turnover Rate
How often inventory is sold and replaced within a given period
Efficiencies in inventory and avoiding overstocking
Days Inventory Outstanding
Average number of days items remain in inventory before being used or sold
Indicates how long capital is tied up in inventory
Stockout Rate
Frequency at which items are unavailable when needed
Directly affects service delivery and customer satisfaction
Inventory Accuracy Rate
Percentage alignment between recorded and actual inventory levels
Reduces discrepancies, prevents shrinkage and losses
Carrying Cost of Inventory
Total cost associated with holding inventory (storage, insurance, depreciation)
Helps optimize order quantities and reduce expenses
Shrinkage Rate
Percentage of inventory lost due to theft, damage, or administrative error
Identifies potential issues in inventory handling
Reorder Point Compliance
Percentage of items reordered at the optimal stock level
Prevents stockouts or excessive overstocking
Supplier Lead Time
Average time taken by suppliers to deliver new stock
Affects replenishment planning and job scheduling
Impact
Operational KPIs
Executives
Operation Managers
Purpose
Optimize everyday service delivery, workforce productivity, asset use, and customer experience.
KPI
Description
Service Completion Time
Time between job scheduling and final sign-off
Reveals process bottlenecks
Technician Utilization Rate
% of technician hours spent on billable work
Increases workforce deployment efficiency
First-Time Fix Rate
% of service jobs that resolve issues on initial visit
Boosts customer satisfaction and lowers costs
Inventory Turnover Rate
Frequency supplies, chemicals, or equipment are used/replenished
Prevents stockouts and excess holding
Warranty Claim Frequency
Number/rate of warranty repairs per period
Monitors product or installation quality
Maintenance Renewal Rate
Percentage of expiring contracts renewed monthly/quarterly
Gauges service revenue stability
Customer Satisfaction Score
Direct client feedback (post-service surveys)
Informs service team coaching/training
Emergency Callout Response Time
Speed of responding to urgent or unplanned jobs
Mitigates negative customer impact
Impact
Business Intelligence (BI) platforms have traditionally relied on data warehouses as their primary source of information. Data warehouses consolidate data from multiple sources into a centralized system, making it easier to conduct analytics and generate reports. BI tools then present this data to users through interactive dashboards, charts, reports, and maps.
Many data warehouses include an Online Analytical Processing (OLAP) engine, which supports multidimensional queries. For example, a business might compare sales in the eastern and western regions over the past two years. OLAP enables deep data exploration, complex calculations, and predictive analytics, offering consistent and reliable outputs that can improve product quality, customer experience, and operational efficiency.
Data lakehouses are also becoming a key part of modern BI. They combine the strengths of both data lakes and data warehouses, offering a unified platform for structured and unstructured data, with improved performance and flexibility for advanced analytics.
The typical BI process follows these steps:
-
Data Sources: Identify relevant data, which may come from data warehouses, data lakes, cloud platforms, CRM systems, sales tools, supply chain data, social media, or external industry sources.
-
Data Collection: Gather and clean data from these sources, using manual methods like spreadsheets or automated tools such as ETL (Extract, Transform, Load) pipelines.
-
Analysis: Explore the data to identify patterns, trends, or anomalies using techniques such as data mining, modeling, or discovery tools.
-
Visualization: Present insights through visual tools like dashboards, graphs, and charts using platforms such as Tableau, Power BI, SAP, or Excel. Features like drill-down, drill-through, and drill-up allow for deeper exploration of data layers.
-
Action Planning: Translate insights into actionable strategies by comparing historical performance with key performance indicators (KPIs). This might include improving processes, refining marketing strategies, addressing supply chain inefficiencies, or enhancing customer experiences.

How does BI work?
Learn More about
Business Intelligence Tools
-
Improved Reporting
-
Business intelligence tools allow users to ask intuitive questions and receive clear, understandable answers.
-
Dashboards highlight key metrics, making it easier for both analysts and non-technical users to focus on what matters most.
-
Teams can make informed decisions based on real data rather than assumptions—whether related to sales, supply chain, customer feedback, or market conditions.
-
-
Unified Data View
-
BI platforms consolidate data from diverse internal and external sources, offering a comprehensive view of the business.
-
This unified perspective supports strategic planning by providing accurate, real-time insights into performance and market position.
-
-
Operational Efficiency
-
Analytics help organizations monitor performance against key benchmarks, identify inefficiencies, and drive continuous improvement.
-
Data-driven insights can uncover supply chain delays, improve resource allocation, and highlight areas where organizational or process changes are needed.
-
-
Advanced Insights
-
BI enables deeper analysis into customer behavior, preferences, and emerging market trends.
-
These insights support smarter marketing, more relevant product development, and improved return on investment through better targeting and planning.
-
-
Faster Decision-Making
-
With real-time analytics and progress tracking, businesses can make timely decisions and respond quickly to changing conditions.
-
-
Enhanced Customer Service
-
Access to customer data enables service teams to respond more efficiently, resolve issues faster, and deliver a more personalized experience.
-
-
Greater Employee Satisfaction
-
Self-service BI tools empower employees with immediate access to critical data, streamlining workflows and reducing redundant tasks.
-